

TLDR: You can address overfitting and get a sense for individual feature significances by adding randomly permuted features to your machine learning model
Machine learning originates from the field of pattern recognition. 1 Therefore it is no wonder that related algorithms learn/extract pattern from data sources to fulfil prediction, classification or clustering tasks. Often the found patterns are fitting mathematical descriptions of the real world causal relations.
However, when the data is noisy, the learned patterns can describe the noise instead of the relevant, underlying causal connections. This is denoted by the term overfitting. Overfitting is really bad for your model performance because it means that your algorithm is not generalizing properly beyond the given data.
Therefore, during the deployment of machine learning models, one has to make sure that the found patterns are general and not data set depended. Some machine learning algorithms such as Support Vector Machines, Neural Networks, bagged/boosted models etc. have a strong black box character that makes it hard to address the quality of the found patterns. In such black box models the saved patterns are represented by complex mathematical models that are powerful but also hidden from view.
An important machine learning paradigm to deal with the black box character and the missing understandment of the found patterns is to always evaluate the performance of an algorithm on data that has not been used to train the algorithm. This is called cross validation and is used to address the quality of the whole model. But in addition to the hollistic model performance, the statistical power of individual features are also of interest.
Hence, to address both the problem of overfitting in general and to address the individual feature significance, I propose to
„Always add randomly permuted versions of the features to your model“.
What do I mean by this? After extracting features from the unstructured data sources, add permuted versions of the original features to your model. Then do your statistical analyses, model fitting, plotting etc. on the union of both original and altered features.
There are two benefits to this:
In the following, we fit a linear regression model for a group of 10 real valued features to predict the real valued target variable :
When all variables are standardized, the importance of a feature can be associated with the absolute value of the coefficients . Higher values of the coefficient correspond to a higher influence of the feature on the target variable.
So we start up iPython and load the necessary packages. We will use the diabets data set from sklearn:
import matplotlib.pyplot as plt
import numpy as np
from sklearn import datasets, linear_model
from sklearn.preprocessing import scale

# Load and standardize the diabetes dataset
diabetes = datasets.load_diabetes()
X = scale(diabetes.data)
y = diabetes.target
y = (y-np.mean(y))*1.0/np.std(y)
Afterwards we fit a linear regression model on the features and plot the values of the coefficients for the 10 features.
# Create and train the linear regression object
regr = linear_model.LinearRegression()
regr.fit(X, y)

# Plot the coefficients
plt.figure(figsize=[10,10])
plt.bar(np.arange(len(regr.coef_))-0.5, regr.coef_, color=["blue"]*10)
plt.xlim([-1,10])
plt.xlabel("Feature", fontsize=16)
plt.ylabel("Coefficient", fontsize=16)
plt.show()
This results in the following figure:
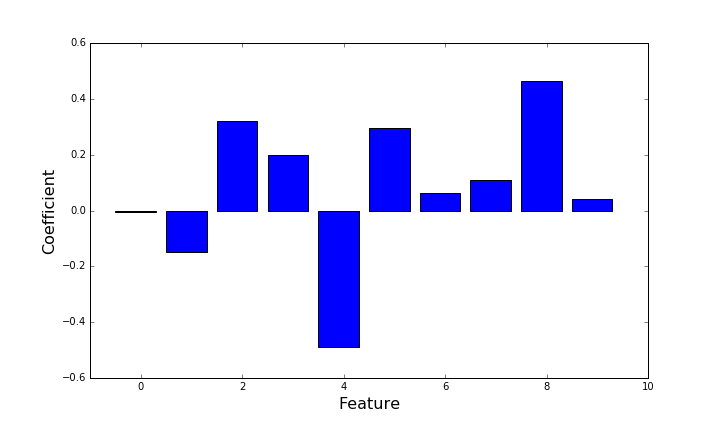
From this plot, I would assume that feature 1 - due to its low coefficient - does not have a linear correlation to the target and is therefore not of importance in the linear regression model. However, those values seem somehow arbitrary, I am not able to compare them to some kind of baseline coefficient.
Now we add 10 new features that are randomly permuted versions of the existing features to your model. We train our linear regression model again und plot the 20 coefficients:
# Shuffle each column independently
Xp = X.copy()
np.random.seed(42)
for i in range(Xp.shape[1]):
    np.random.shuffle(Xp[:,i])

# Add permuted features
X_ext = np.c_[ X, Xp]

# Create and train the linear regression object
regr_ext = linear_model.LinearRegression()
regr_ext.fit(X_ext, y)

# Plot the coefficients
plt.figure(figsize=[10,10])
plt.bar(np.arange(len(regr_ext.coef_))-0.5, regr_ext.coef_, color=["blue"]*10+["red"]*10)
plt.xlim([-1,20])
plt.xlabel("Feature", fontsize=16)
plt.ylabel("Coefficient", fontsize=16)
plt.show()
This results in the following plot:
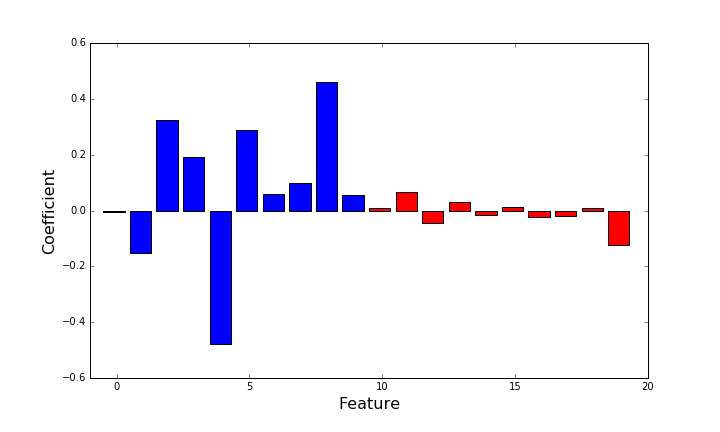
The red bars denote the coefficients of the randomly permuted features. They are statistically independent from the target and state a baseline influence niveau. In such a situation, all features that have a lower absolute coefficient value than the maximum of the permuted versions should be examined critically. Here, on a first sight features, 3, 5, 6 and 9 can be considered as (possibly) significant because the absolute value of their importance is higher than the randomly permuted versions.
The Boruta feature selection algorithm is based on this principle of adding permuted versions of the original features to a model 2. It repeatedly trains random forests on both original and permuted features. Afterwards it compares how often the randomized and original features were selected. When the permuted versions were selected too often, the Boruta algorithm assumes the respective feature to be unimportant.
During prototyping and proof-of-concept type projects, especially when it is not clear how much evidence is contained in the data and resulting features I always add permuted versions of the original features. This helps to address both overfitting and uncertainty of individual feature significances.
See the introduction of “Pattern recognition and machine learning” by Christopher M. Bishop ↩
See the paper “Boruta – A System for Feature Selection.” by Miron B. Kursa, Aleksander Jankowski , Witold R. Rudnicki or the Scikit-learn compatible python implementation by Daniel Homola ↩