

TLDR: The following post describes a three step paradigm on how to make yourself familiar with tabular data sources in a structured fashion.
In the beginning of every Data Science project you have to make yourself familiar with given data sources. To do so, you as a Data Scientist have to understand the underlying business processes that generate those data. This is especially relevant if you work as a consultant and switch industries, clients, investigated issues and with it the data structures every few months.

Depending on the industry, data generating processes can be very complex and as always the ‘devil is in the details’. Further, stakeholders often do not understand important concepts for the successful application of Machine Learning components. So the Data Scientists has to make sure that the right questions are asked in the right order.
But I noticed that even experienced Statisticians and Data Scientists often jump between asking questions on a global level
“How can I associate Table 1 with Table 2?”
and going into detail by asking very specific questions
“What does Value C in Column X in Table AB indicate?“.
What is dangerous about asking in such an unstructured fashion? It can confuse the client. He cannot deduce how deep your current understanding of the data is. Detailed questions that are asked too early could leave the impression that all general questions are already solved.
Also, one could miss important aspects, for example you forget to ask how one can relate a certain table to the others. If you do this later during the building of statistical models, it could appeal unprofessional.
I developed a three phase question method for myself. As I could not find any Data Science question structuring method or guideline I decided to share my approach.
So how should we structure the asking process? The principle is to start by getting to know the data on a global overview and then later zoom in. So we start asking very general questions that are continuously sharpened. It is not a strict three step tutorial but more of a way of structuring your thoughts while getting a deep understanding of the data sources in the project.
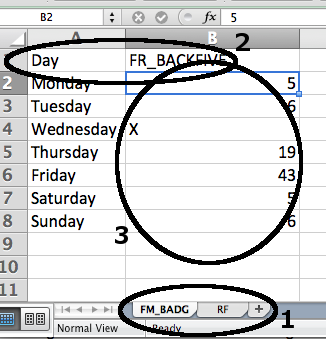
There are three levels in the familiarizing process. After completing all questions of the current level you move one level forward. The three level in sequential order are: Table, column and cell level. The following figure visualizes the three phases of the make-yourself-familiar process:
The three phases go as follows:
1. Table level:
First the different tables themselves and how they relate to each other are under investigation:
In the figure from above an exemplary question would be “How can I link table FM_BADG to table RF?”.
2. Column level:
Now we understand the tables which is why we start asking questions about the different columns:
An exemplary question on this level could be “Which Information does column FR_BACKFIVE contain?”.
3. Cell level:
Now we have a deeper understanding of both columns and tables which is why we start caring about individual values:
An exemplary question during this level for the figure from above could be “What does the value X in column FR_BACKFIVE denote?”.
In total this structuring seems very obvious but I noticed that many -even experienced- Data Scientists, in the heat of the moment, tend to skip between those levels in their getting-familiar-with-the-data process.
In my work as a Data Scientist I always try to respect this order when getting to know new tabular data sources.
There are several advantages of my three level question method. It will help you structuring your thoughts and the getting-familiar-with-the-data process. Besides, from the level of your questions clients and stakeholders can get a feeling on how deep your understanding is.
Moreover you can omit certain detail questions if you find out that a certain table cannot be linked to the other tables. This will help you to save valuable time and be more productive. For example if the data in one table cannot be reliable linked to other tables, you would probably omit that table in your analyses.
The method is thought for relational data where several tables have to be connected. Probably it can be generalized to other data sources as well but I am lacking experience in those fields.
I would love to get your feedback so I uploaded the question scheme to Github. If you think that I missed an important question or level you can just add it there.
In one of the projects I participated we had several tables having columns with the same name “ID”. It was obvious that those were used as keys to associate the tables together. What was not clear was that one had to add 1 to every “ID” in one table to get the right association key to the other tables. So an ID of 6 in this table corresponded to an ID of 7 in the other tables. We would have missed this and probably build wrong features if we had not asked detailed questions about the association process early on. ↩
Think of credit classes A, B, C where A is the most solvent, B is medium solvent and C is less solved. Hence there exists a natural order between those classes A>B>C with respect to the solvency. ↩